
 $0.17
$0.17
Highlights
- After-tax NPV5% C$523 million and after-tax IRR of 99.7% at a base case gold price of US$3,500/ounce (“oz”) and an after-tax NPV5% of C$935M and an IRR of 181% at a gold price of US$4,500/oz
- Base case average annual after-tax free cash flow1 (excluding initial capital expenditures) of C$85M and cumulative after-tax free cash flow of C$767M; first 5 years of production $354 M after-tax free cash flow (excluding initial capital expenditures)
- LOM Cash Costs1 of US$1,835/oz and All-In Sustaining Costs (“AISC”)1 of US$2,149/oz at the base case gold price
- 81% of the gold production coming from Indicated resources
- Initial Capital: ~C$51 million
- Payback Period: <1 year
- Phased open-pit and underground development utilizing toll milling
Toronto, Ontario – February 18, 2026 – RPX Gold Inc. (“RPX Gold” or the “Company”) (TSXV: RPX) is pleased to announce the results of a Preliminary Economic Assessment (“PEA”) for its 100%-owned Wawa Gold Project (the “Project”) located in northwestern Ontario, Canada. The PEA was prepared by DRA Americas Inc. (“DRA”), in accordance with National Instrument 43101 Standards of Disclosure for Mineral Projects (“NI 43-101”). All amounts are in Canadian dollars, unless otherwise stated.
The PEA outlines a phased development plan beginning with open pit mining of near surface mineralization followed by underground mining. The Project has been evaluated at a life of mine (“LoM”) average of 2,000 tonnes per day (“t/d”) of Run of Mine (“ROM”) and demonstrates strong economics using a long-term gold price of US$3,500/oz (the “Base Case”), and enhanced economics using a long-term gold price of US$4,500/oz (the “Upside Case”). Readers are cautioned that at this time no production decision in respect of the Project has been made. Any such decision will be dependent on further exploration and the preparation of a feasibility study which has not been completed, as well as other factors.
The PEA is supported by an updated mineral resource estimate (“2026 MRE”), which resulted in a 48% increase in indicated ounces of gold (compared to the 2024 MRE announced on September 4, 2024), showing improved confidence in the estimation upon which the PEA is based. The 2026 MRE is inclusive of an open pit- and underground mineral resource, prepared by WSP Canada Inc. (“WSP”).
Michael Michaud, President and CEO of RPX Gold commented: “the PEA marks a significant milestone for RPX Gold, outlining an expedited, phased development plan, transitioning from open pit to underground mining, with a low-capital path to the first stage of gold production. This mining scenario leverages existing infrastructure and nearby milling capacity that potentially eliminates the need for a mill or tailings facility, streamlining both permitting and construction. The PEA validates the Wawa Gold Project as a highly attractive development opportunity with substantial exploration upside. In the event a production decision is made, the low risk, staged development approach provides an opportunity to generate cash flow from the initial open pits to be used to further explore and develop the larger mineral resource.”
PROJECT ECONOMICS
The financial highlights of the Wawa Gold Project are presented in Table 01.
Table-01: Financial Highlights
| PEA Base Case | Alternate Upside Pricing Case | |
| Gold Price – US$ | $3,500 | $4,500 |
| Exchange Rate – C$/US$ | 1.35 | 1.35 |
| Life of Mine – years | 9 | 9 |
| All amounts in million C$ unless otherwise specified | ||
| Average Annual After -Tax Free Cash Flow1 | $85 | $145 |
| Pre-Tax Net Present Value (5% discount rate) | $789 | $1,401 |
| After-Tax Net Present Value (5% discount rate) | $523 | $935 |
| Internal rate of return (after-tax) | 99.7% | 181% |
| Payback (after-tax) | 0.9 years | 0.5 years |
| Capital Expenditure (Initial) | $51 | $51 |
| Capital Expenditure (Sustaining) | $235 | $235 |
| AISC (US$ per ounce)1 | US$2,149 | US$2,169 |
| NOTES LoM Cash costs per ounce of gold, all-in sustaining cost (“AISC”) per ounce of gold and free cash flow are non-GAAP measures or ratios. These measures have no standardized meaning under IFRS and may not be comparable to similar measures used by other issuers. Refer to the “Non-GAAP Financial Measures” section of this news release for more information, including a detailed description of these measures. Reference date of the economic analysis is the production decision on the Project. The analysis assumes that no initial capital is spent in advance of this decision, which has not been made as of the date hereof. | ||
PRODUCTION HIGHLIGHTS
The production highlights of the Wawa Gold Project are presented in Table 02.
Table-02: Production Highlights
| Units | Open Pit Years 1-3 | Underground Years 3-9 | |
| Operating Units | |||
| Material Processed (LoM) | Mt | 2.1 | 4.5 |
| Material Processed, Annual average3 | Mt/y | 0.70 | 0.73 |
| Gold Grade (LoM average) | g/t Au | 2.4 | 3.6 |
| Gold Recovery (LoM average) | % | 88 | 88 |
| Gold Production, Annual average3 | koz Au | 48 | 74 |
| Strip Ratio | w:o | 10.6 | – |
| Operating Costs | |||
| Mining | C$/t processed | $66 | $124 |
| Material Transport and Processing | C$/t processed | $96 | $96 |
| General and Administrative | C$/t processed | $15 | $15 |
| Royalties1,2 | C$/t processed | $9 | $9 |
| NOTES The royalties cost in terms of C$/t material processed presented above excludes C$1.8M in royalty buyback costs, which are included elsewhere in the economic analysis of the Project. Royalties based on US$3,500 gold price. Underground annual averages are based on the 6 years of substantial production from the underground mine, excluding the smaller quantities of material mined during ramp up in Y2 and during ramp down in Y9. | |||
Cautionary statement: Readers are cautioned that a PEA is preliminary in nature, it includes inferred mineral resources that are considered too speculative geologically to have economic considerations applied to them that would be enable them to be categorized as mineral reserves, and there is no certainty that the PEA will be realized. In addition, the assumption that toll milling will be utilized for processing the material requires agreement with a third-party, which has not been obtained.
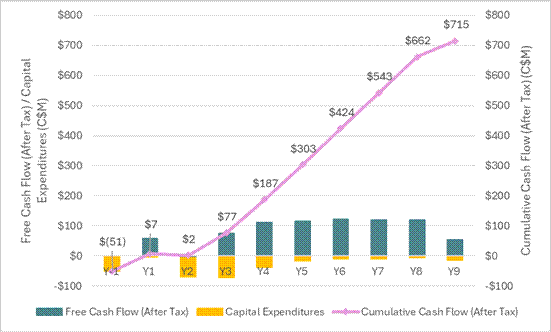
The Base Case free cash flow (after-tax) and cumulative cash flow (after-tax) profile is shown in Figure 01, which illustrates the impact of capital expenditures on these parameters.
Figure-01: After-Tax Free Cash Flow Profile at US$3,500 Gold
ECONOMIC SENSITIVITIES
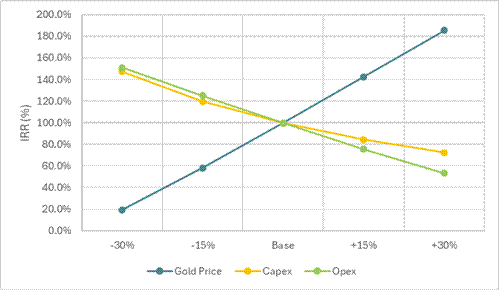
A sensitivity analysis was carried out, using the Base Case as a starting point, to assess the impact of changes in the price of gold, total capital expenditures (“Capex”) and operating expenditures (“Opex”) on the Project’s net present value (“NPV”) at a 5% discount rate and internal rate of return (“IRR”). The impact of each variable is examined individually with an interval of ±30% and increments of 15% applied. The after-tax results of the sensitivity analysis are shown in Figure 02 and Figure 03. The Project is sensitive to the gold price, with lower sensitivities observed to changes in Capex and Opex.
Figure-02: After-Tax NPV 5% Sensitivity to Capex, Opex and Gold Price
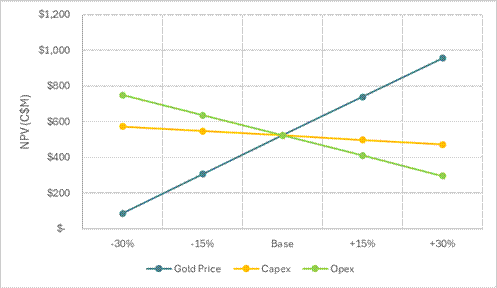
Figure-03: After-Tax IRR Sensitivity to Capex, Opex and Gold Price
The sensitivities of the key after-tax economic metrics of the Project were also evaluated at specific gold prices. The results of this analysis are shown in Table 03 with the Base Case highlighted.
Table-03: After-Tax Sensitivity of Economic Parameters to Gold Price
| Gold Price | US$/oz | 2,450 (Base -30%) | 2,975 (Base -15%) | 3,500 (Base) | 4,025 (Base +15%) | 4,550 (Base +30%) |
| NPV @ 5% | C$M | $86 | $305 | $523 | $739 | $955 |
| IRR | % | 19% | 58% | 100% | 143% | 185% |
| Payback Period | years | 5.5 | 3.2 | 0.9 | 0.7 | 0.5 |
DEVELOPMENT STRATEGY AND CAPITAL DISCIPLINE
The PEA was deliberately designed around a capital efficient, high-margin development strategy intended to generate early free cash flow, reduce execution risk, and position the Project to become self-sustaining at an early stage of development.
The mine plan prioritizes easily accessible near-surface mineralization in the early years using an elevated cut-off grade strategy, followed by underground production, while leveraging existing regional infrastructure and toll milling potential. This approach significantly reduces upfront capital requirements by avoiding the construction of a standalone processing facility, resulting in an initial Capex of approximately $51 million, which is materially lower than comparable projects.
With a strong projected cash flow profile with C$303 million cumulative after-tax cash flow net of capital expenditures in the first 5 years of production, rapid payback, and high internal rates of return, the Project is expected to fund ongoing underground development, exploration, and future optimization to reduce reliance on repeated equity financings and thus, shareholder dilution. The Project retains flexibility to scale operations as market conditions permit. Additionally, the Company has available up to C$69 million in tax pool balances that are not reflected in the financial model for the Project.
Importantly, once the Project has achieved steady-state cash flow, the PEA mine plan maximizes the value of the existing mineral resource while preserving substantial upside for future expansion with its demonstrated nearby exploration potential. This phased strategy provides RPX Gold with a clear pathway from development to production while maintaining financial discipline and longterm optionality.
MINERAL RESOURCE ESTIMATE
The PEA is supported by the 2026 MRE as presented in Table 04. The 2026 MRE shows a quantity of Indicated mineral resources of 1,244,000 ounces, representing an increase of more than 400,000 ounces (from 842,000 ounces to 1,244,000 ounces), or 48% from the 2024 MRE, while the overall size of the mineral resource remains comparable to the 2024 MRE. This demonstrates a marked improvement in confidence in the mineral resource model supporting the PEA.
The 2026 MRE continues to refer to a small portion of the Company’s land holdings. Numerous historic zones and high priority targets are included in the Wawa Gold Project property and have potential to expand the mineral resource. In both the Jubilee and the Minto deposits, the mineral resource remains open along strike and down-dip.
The 2024 MRE and the 2026 MRE were derived using a 3D block modelling approach, based on Inverse Distance Cubed (ID3) grade interpolation and reported from grade cut-offs and constraining volumes for open-pit (OP) and underground (UG) mining.
Mineral resources are not mineral reserves, and do not demonstrate economic viability. There is no certainty that all, or any parts, of this mineral resource that are the subject of this press release will be converted into mineral reserves. Inferred mineral resources are considered too speculative geologically to have economic considerations applied to them that would enable them to be categorized as mineral reserves.
Table-04: 2026 Mineral Resource Estimate for the Wawa Gold Project (Effective Date December 8, 2025)
| Category | Resource | Tonnes | Au (g/t) | Au (oz) |
| Indicated | Open Pit | 22,378,000 | 1.65 | 1,190,000 |
| Indicated | Underground | 531,000 | 3.16 | 54,000 |
| Total Indicated | 22,909,000 | 1.69 | 1,244,000 | |
| Inferred | Open Pit | 7,534,000 | 1.24 | 300,000 |
| Inferred | Underground | 2,417,000 | 2.69 | 209,000 |
| Total Inferred | 9,951,000 | 1.59 | 509,000 |
Notes:
- The 2026 MRE has been reported in-situ and has been prepared in accordance with the CIM Standards (2014) and follows Best Practices outlined by the CIM (2019).
- Mineral resources that are not mineral reserves do not have demonstrated economic viability. There are no mineral reserves for the Wawa Gold Project.
- The QP (for purposes of National Instrument 43-101 – Standards of Disclosure for Mineral Projects (“NI 43-101”)) for the 2026 MRE is Brian Thomas, P.Geo., an employee of WSP and is “independent” of the Company within the meaning of Item 1.5 of NI 43-101.
- The effective date of the 2026 MRE is December 8, 2025.
- A minimum thickness of 3 metres was used when interpreting the mineralized bodies.
- The 2026 MRE is based on sub-blocked models with a main block size of 3 metres x 3 metres x 3 metres.
- The open pit-constrained mineral resources are reported at a 0.4 g/t Au cut-off grade considering an Operating Expense (“Opex”) of C$28.00/t ($4.00/t mining, $19.00/t processing, $5.00/t G&A)
- The underground constrained mineral resources are reported at a 1.5 g/t Au cut-off and a minimum of 2,000 t of contiguous material contained within a 1.40 g/t grade envelope. The 1.5 g/t cut-off assumes underground long hole mining with an Opex of C$144.00/t ($120.00/t mining, $19.00/t milling, $5.00/t G&A).
- A bulk density factor of 2.77 tonnes per cubic metre (t/m3) was applied for the 2026 MRE.
- A gold price of C$3,864 (US$2,800) per ounce as used, and a C$/US$ exchange rate of 1.38.
- Mill recovery of 87% was assumed.
- Royalty of 2.0% (reduced from 3.5% assuming expected re-purchasing of 1.5% of NSR from previous joint venture partner for C$1.75 million. Franco-Nevada holds an option to purchase additional royalty of 0.5% upon completion of feasibility study).
Neither the proceeds to purchase this potential additional royalty nor the 0.5% has been included in the PEA. 13) Rounding may result in apparent summation differences between tonnes, grade, and metal content.
MINING
The mining methods used for the PEA are conventional open pit mining using truck and shovel followed by underground mining using long hole stoping. The mining schedule assumes one year of pre-production development for the open pits, followed by open pit mining during Years 1 to 3 from a north pit and a south pit, with underground development beginning in Year 2 and underground mining commencing in Year 3 (Figures 04 and 05). The stripping ratio for the open pits is approximately 10:1 given the elevated cut-off grade (0.83 g/t Au) for transporting and processing material at a toll mill. Additionally, wider ramps were designed to allow for larger haul trucks to ensure the 2,000 tonne per day production rate. The lower grade material below the cutoff grade (based on mining and on-site processing costs) will be stockpiled for potential processing in a possible on-site mill in the future, as economics allow.
The main part of the underground mine will be accessed from three portals; two located within the south pit and one within the north pit. Contract mining is assumed to be utilized for both the open pit and underground operations. Therefore, no mining equipment capital costs have been included, as contractor-supplied equipment is incorporated into operating costs over the life of mine. The Capex includes initial capital provisions for mining services, buildings, maintenance facilities, and supporting infrastructure.
Approximately 63% of the ounces in the open pits and 86% of the ounces in the underground mine plan considered in the PEA are in the indicated category, outlining a clear path forward for a drill program required to complete the conversion of inferred ounces (currently included in the mine plan) to indicated in preparation for a pre-feasibility study (“PFS”).